Test Module Components
| Category | Name | Version | Status |
|---|---|---|---|
| generic | Docker CE | 28.4.0 | Installed |
| Docker Images | metro2.0/media_performance_benchmark_runner | 2.0 | Installed |
| Docker Images | metro2.0/ai_frequency_measure_runner | 2.0 | Installed |
| Docker Images | metro2.0/proxy_pipeline_benchmark_runner | 2.0 | Installed |
| Docker Images | metro2.0/openvino_benchmark_runner | 2.0 | Installed |
| Docker Images | metro2.0/stream_memory_benchmark | 2.0 | Installed |
Additional Data
System Info
| Section | Field | Value |
|---|---|---|
| HARDWARE INFO | Device Manufacturer | Default string |
| HARDWARE INFO | Hardware Architecture | x86_64 |
| HARDWARE INFO | Processor | 13th Gen Intel(R) Core(TM) i7-13700TE |
| HARDWARE INFO | GPU PCI ID | a780 (Intel® UHD Graphics) |
| HARDWARE INFO | GPU Memory Size | 256M (Intel® UHD Graphics) |
| HARDWARE INFO | Memory Size | 62Gi |
| HARDWARE INFO | Monitor | Monitors: 1 |
| HARDWARE INFO | Monitor | 0: +*DP-1 1920/600x1080/340+0+0 DP-1 |
| HDD Configurations | Model | ATA TS1TSSD472K-I (scsi) |
| HDD Configurations | Disk /dev/sda | 1024GB |
| HDD Configurations | Sector size (logical/physical) | 512B/512B |
| HDD Configurations | Partition Table | gpt |
| HDD Configurations | Disk Flags | Number Start End Size File system Name Flags |
| HDD Configurations | Disk Flags | 1 1049kB 1128MB 1127MB fat32 boot, esp |
| HDD Configurations | Disk Flags | 2 1128MB 1024GB 1023GB ext4 |
BIOS Configuration
CPU Power Configuration
Software Info
| Section | Field | Value |
|---|---|---|
| SOFTWARE INFO | OS Version | Ubuntu 24.04.2 LTS |
| SOFTWARE INFO | Kernel Version | 6.14.0-29-generic |
| SOFTWARE INFO | OpenVINO Version (Base) | 2025.2.0 |
| SOFTWARE INFO | OpenVINO Version (for DLStreamer) | 2025.2.0 |
| SOFTWARE INFO | OpenVINO Version (for OpenCV/FFMpeg) | 2025.2.0 |
| SOFTWARE INFO | Docker CE Version | 28.4.0 |
| SOFTWARE INFO | Docker Compose Version | 2.39.2 |
| SOFTWARE INFO | Intel Level Zero for GPU | NA |
| SOFTWARE INFO | Intel Graphics Compiler for OpenCL | 25.05.32567.19-1099 |
| SOFTWARE INFO | Libva / VAAPI Driver | NA |
| SOFTWARE INFO | Media-driver Version | 25.2.4-1146~24.04 |
| SOFTWARE INFO | Intel OneVPL | 1:2.15.0.0-1140 |
| SOFTWARE INFO | Mesa | NA |
| SOFTWARE INFO | OpenCV Version | 4.11.0.86 |
| SOFTWARE INFO | DLStreamer Version | 1.26.4 |
| SOFTWARE INFO | FFmpeg Version | 6.1.1-3ubuntu5 |
| SOFTWARE INFO | NPU Version | 1.19.0.20250707-16111289554 |
| SOFTWARE INFO | Current System Time | 2025-09-18 05:09:44 |
Test Case Results
performance
| Category | Name | Value Type | Logic Type | Expected Value | Value | Parameters | Status | |||
|---|---|---|---|---|---|---|---|---|---|---|
| generic | OpenVINO Benchmark Test | text | eq | No Error | No Error | na | PASSED | |||
| generic | Memory Benchmark Test | text | eq | No Error | No Error | na | PASSED | |||
| generic | Media Performance Test | text | eq | No Error | No Error | na | PASSED | |||
| generic | GPU Freq Performance Test | text | eq | No Error | No Error | na | PASSED | |||
| generic | Smart NVR Proxy Pipeline Benchmark Test | text | eq | No Error | No Error | na | PASSED | |||
| generic | Headed Visual AI Proxy Pipeline Benchmark Test | text | eq | No Error | No Error | na | PASSED | |||
| generic | VSaaS Gateway with Storage Proxy Pipeline Benchmark Test | text | eq | No Error | No Error | na | PASSED | |||
| generic | License Plate Recognition(LPR) AI Proxy Pipeline Benchmark | text | eq | No Error | No Error | na | PASSED | |||
Additional Data
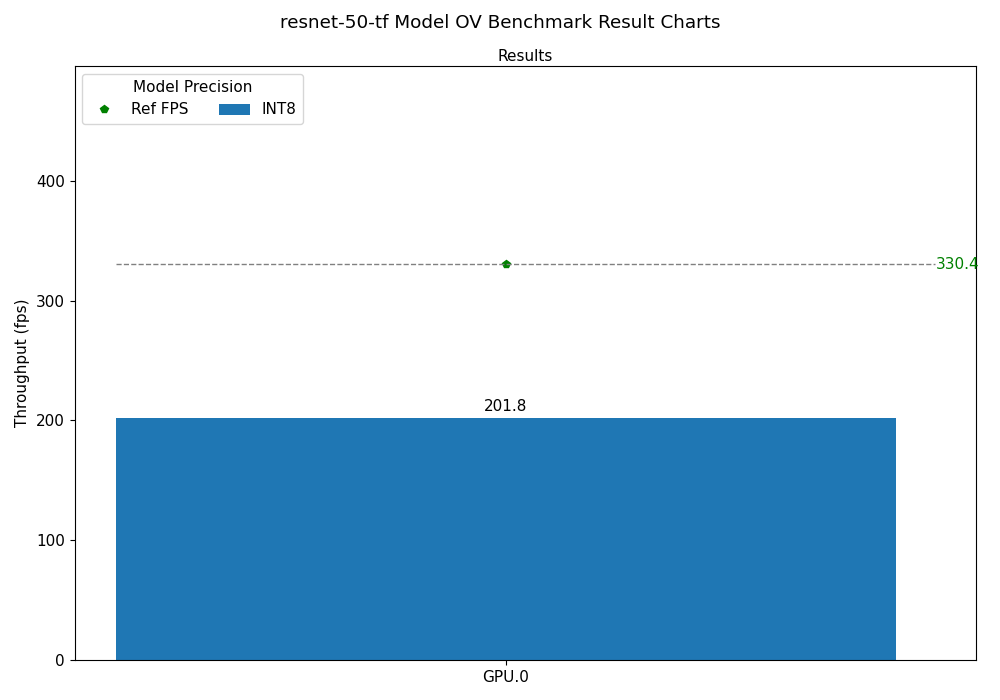
resnet-50-tf OV Benchmark Result
| Model | Precision | Device | Throughput (fps) |
Latency (ms) |
Reference Platform | Reference Throughput (fps) | Reference GPU Freq (GHz) | CPU Avg Freq (GHz) |
CPU Util (norm) (%) |
Memory Util (%) |
GPU Freq (GHz) |
GPU EU Util (%) |
GPU VDBox Util (%) |
GPU Power Util (W) |
Package Power (W) |
Result |
|---|---|---|---|---|---|---|---|---|---|---|---|---|---|---|---|---|
| resnet-50-tf | INT8 | GPU.0 | 201.75 | 316.75 | i7-1360P (16G Mem) | 330.45 | 1.5 | 1.9 | 12.03 | 1.32 | 1.56 | 97.37 | 0.0 | 11.18 | 34.7 | No Error |
resnet-50-tf OV Benchmark Result Chart
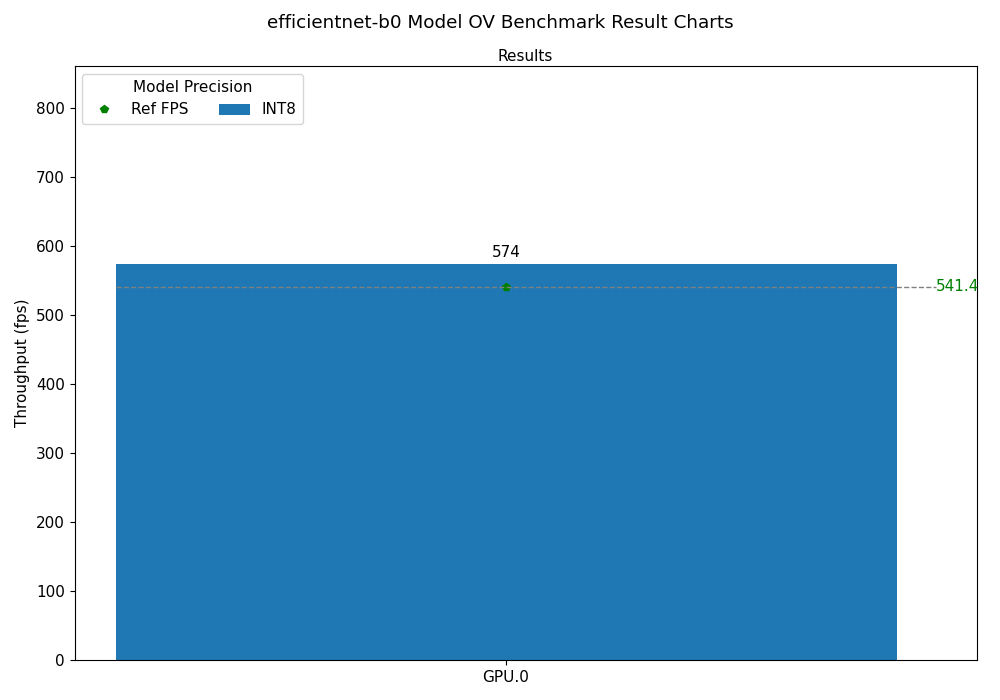
efficientnet-b0 OV Benchmark Result
| Model | Precision | Device | Throughput (fps) |
Latency (ms) |
Reference Platform | Reference Throughput (fps) | Reference GPU Freq (GHz) | CPU Avg Freq (GHz) |
CPU Util (norm) (%) |
Memory Util (%) |
GPU Freq (GHz) |
GPU EU Util (%) |
GPU VDBox Util (%) |
GPU Power Util (W) |
Package Power (W) |
Result |
|---|---|---|---|---|---|---|---|---|---|---|---|---|---|---|---|---|
| efficientnet-b0 | INT8 | GPU.0 | 574.02 | 111.39 | i7-1360P (16G Mem) | 541.37 | 1.5 | 2.08 | 12.46 | 1.68 | 1.55 | 97.43 | 0.0 | 10.38 | 34.96 | No Error |
efficientnet-b0 OV Benchmark Result Chart
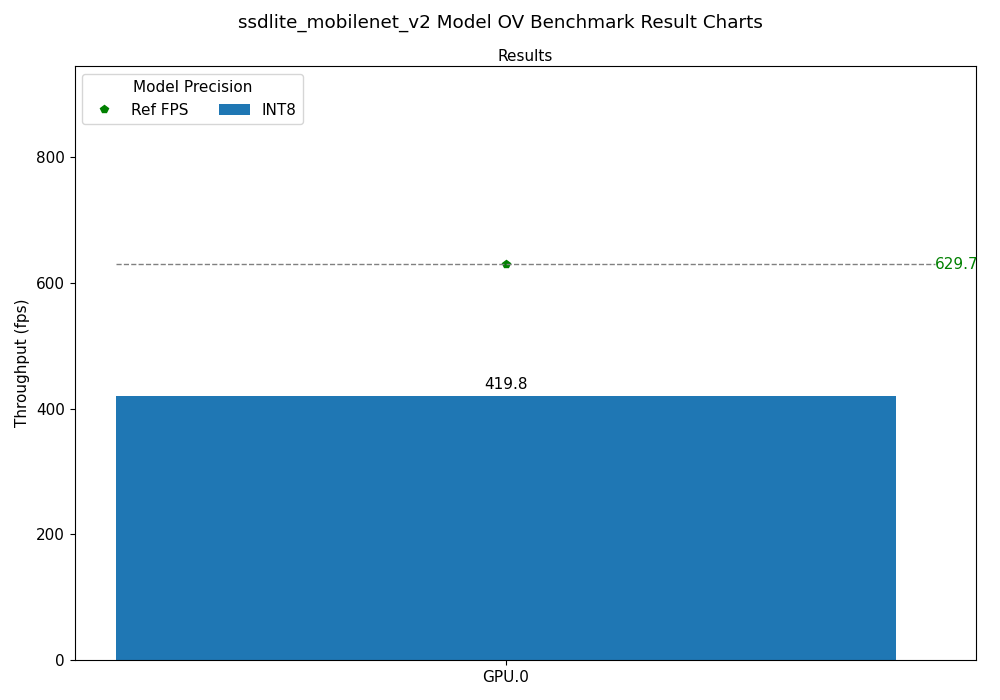
ssdlite_mobilenet_v2 OV Benchmark Result
| Model | Precision | Device | Throughput (fps) |
Latency (ms) |
Reference Platform | Reference Throughput (fps) | Reference GPU Freq (GHz) | CPU Avg Freq (GHz) |
CPU Util (norm) (%) |
Memory Util (%) |
GPU Freq (GHz) |
GPU EU Util (%) |
GPU VDBox Util (%) |
GPU Power Util (W) |
Package Power (W) |
Result |
|---|---|---|---|---|---|---|---|---|---|---|---|---|---|---|---|---|
| ssdlite_mobilenet_v2 | INT8 | GPU.0 | 419.81 | 9.50 | i7-1360P (16G Mem) | 629.72 | 1.49 | 2.42 | 12.31 | 0.97 | 1.59 | 99.18 | 0.0 | 9.71 | 35.07 | No Error |
ssdlite_mobilenet_v2 OV Benchmark Result Chart
mobilenet-v2-pytorch OV Benchmark Result
| Model | Precision | Device | Throughput (fps) |
Latency (ms) |
Reference Platform | Reference Throughput (fps) | Reference GPU Freq (GHz) | CPU Avg Freq (GHz) |
CPU Util (norm) (%) |
Memory Util (%) |
GPU Freq (GHz) |
GPU EU Util (%) |
GPU VDBox Util (%) |
GPU Power Util (W) |
Package Power (W) |
Result |
|---|---|---|---|---|---|---|---|---|---|---|---|---|---|---|---|---|
| mobilenet-v2-pytorch | INT8 | GPU.0 | 1329.87 | 48.06 | i7-1360P (16G Mem) | 1194.67 | 1.5 | 2.28 | 11.87 | 1.02 | 1.57 | 98.59 | 0.0 | 11.54 | 34.98 | No Error |
mobilenet-v2-pytorch OV Benchmark Result Chart

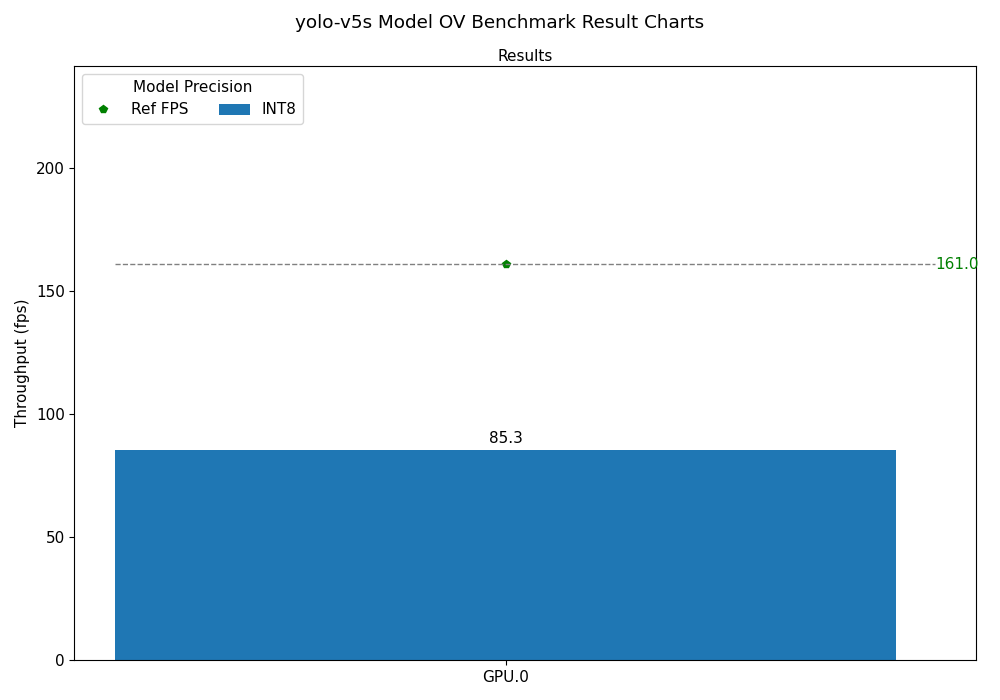
yolo-v5s OV Benchmark Result
| Model | Precision | Device | Throughput (fps) |
Latency (ms) |
Reference Platform | Reference Throughput (fps) | Reference GPU Freq (GHz) | CPU Avg Freq (GHz) |
CPU Util (norm) (%) |
Memory Util (%) |
GPU Freq (GHz) |
GPU EU Util (%) |
GPU VDBox Util (%) |
GPU Power Util (W) |
Package Power (W) |
Result |
|---|---|---|---|---|---|---|---|---|---|---|---|---|---|---|---|---|
| yolo-v5s | INT8 | GPU.0 | 85.34 | 374.30 | i7-1360P (16G Mem) | 160.99 | 2.9 | 1.99 | 12.08 | 1.08 | 1.57 | 98.34 | 0.0 | 11.9 | 34.96 | No Error |
yolo-v5s OV Benchmark Result Chart
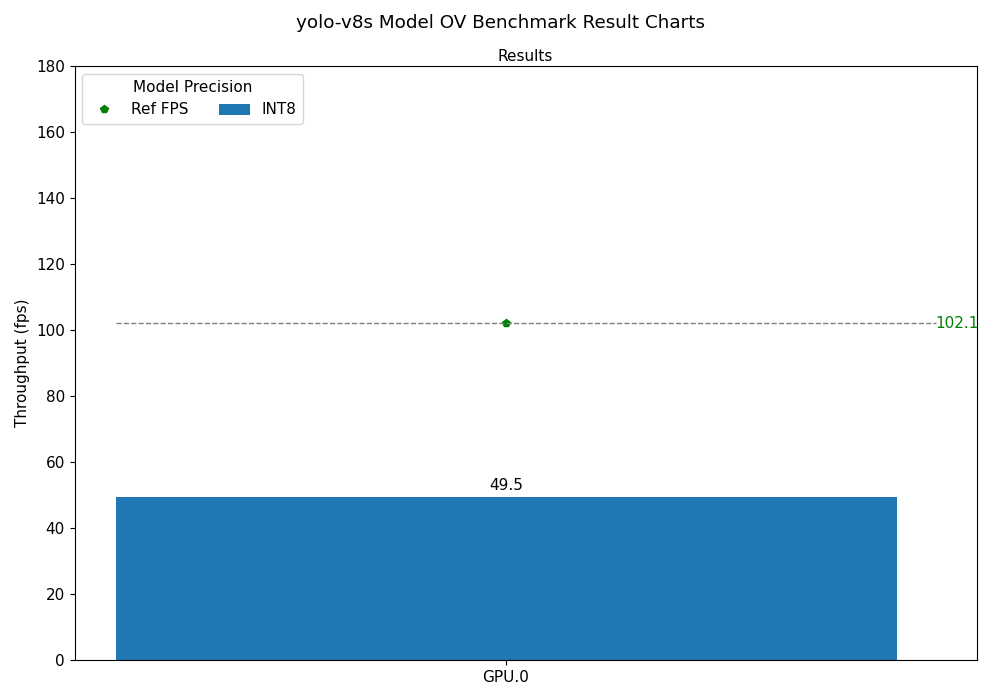
yolo-v8s OV Benchmark Result
| Model | Precision | Device | Throughput (fps) |
Latency (ms) |
Reference Platform | Reference Throughput (fps) | Reference GPU Freq (GHz) | CPU Avg Freq (GHz) |
CPU Util (norm) (%) |
Memory Util (%) |
GPU Freq (GHz) |
GPU EU Util (%) |
GPU VDBox Util (%) |
GPU Power Util (W) |
Package Power (W) |
Result |
|---|---|---|---|---|---|---|---|---|---|---|---|---|---|---|---|---|
| yolo-v8s | INT8 | GPU.0 | 49.54 | 80.68 | i7-1360P (16G Mem) | 102.07 | 1.49 | 2.27 | 12.51 | 1.03 | 1.59 | 99.88 | 0.0 | 11.41 | 35.02 | No Error |
yolo-v8s OV Benchmark Result Chart
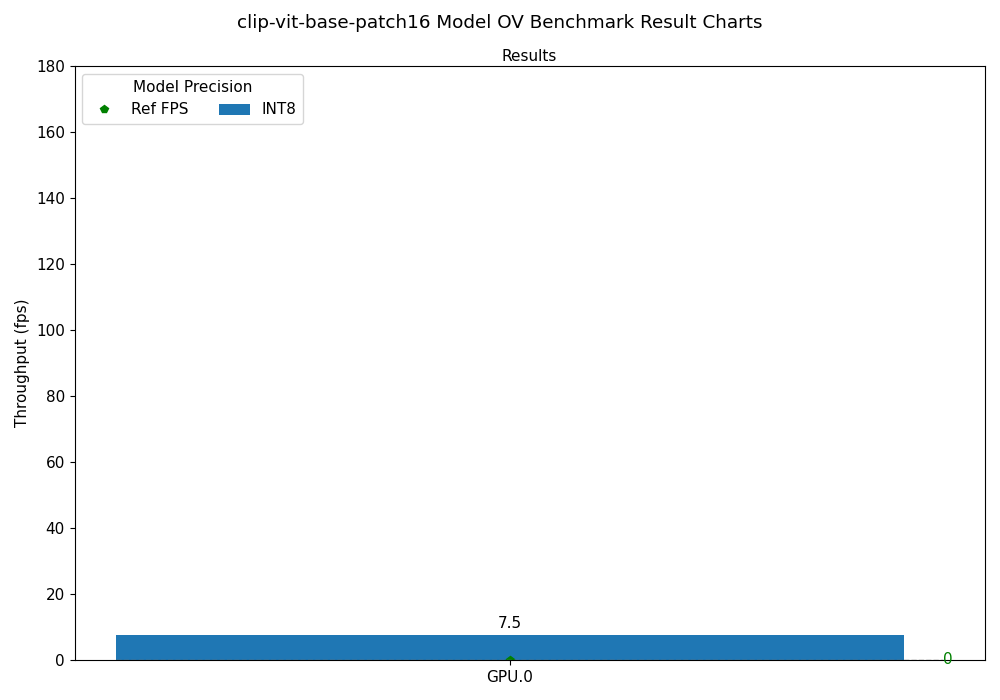
clip-vit-base-patch16 OV Benchmark Result
| Model | Precision | Device | Throughput (fps) |
Latency (ms) |
Reference Platform | Reference Throughput (fps) | Reference GPU Freq (GHz) | CPU Avg Freq (GHz) |
CPU Util (norm) (%) |
Memory Util (%) |
GPU Freq (GHz) |
GPU EU Util (%) |
GPU VDBox Util (%) |
GPU Power Util (W) |
Package Power (W) |
Result |
|---|---|---|---|---|---|---|---|---|---|---|---|---|---|---|---|---|
| clip-vit-base-patch16 | INT8 | GPU.0 | 7.52 | 530.79 | i7-1360P (16G Mem) | 0 | 0 | 1.85 | 12.17 | 1.57 | 1.58 | 98.85 | 0.0 | 11.4 | 35.0 | No Error |
clip-vit-base-patch16 OV Benchmark Result Chart
Memory Benchmark Test Result
This test runs a memory benchmark based on STREAM to ensure sufficient memory bandwidth for media processing.
| memory_benchmark_runner_test | Function | Best Rate MB/s | Avg time | Min time | Max time | Result |
|---|---|---|---|---|---|---|
| Memory_Benchmark_Test | Copy | 67046.3 | 0.029108 | 0.028637 | 0.029859 | No Error |
| Memory_Benchmark_Test | Scale | 57061.3 | 0.034324 | 0.033648 | 0.035458 | No Error |
| Memory_Benchmark_Test | Add | 62305.5 | 0.048833 | 0.046224 | 0.050605 | No Error |
| Memory_Benchmark_Test | Triad | 60301.5 | 0.049745 | 0.047760 | 0.052212 | No Error |
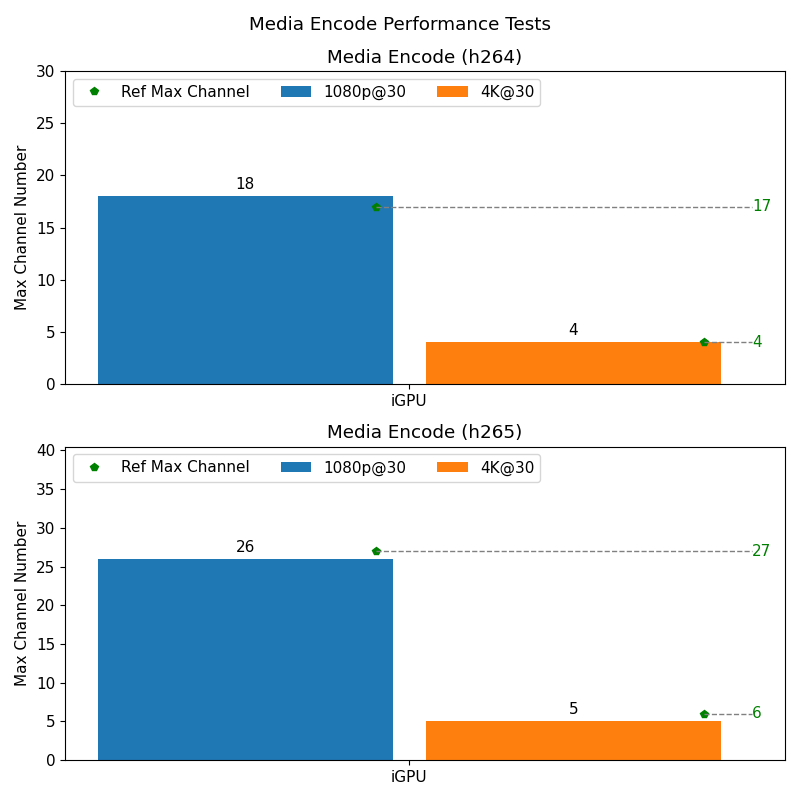
Media Performance Test Result
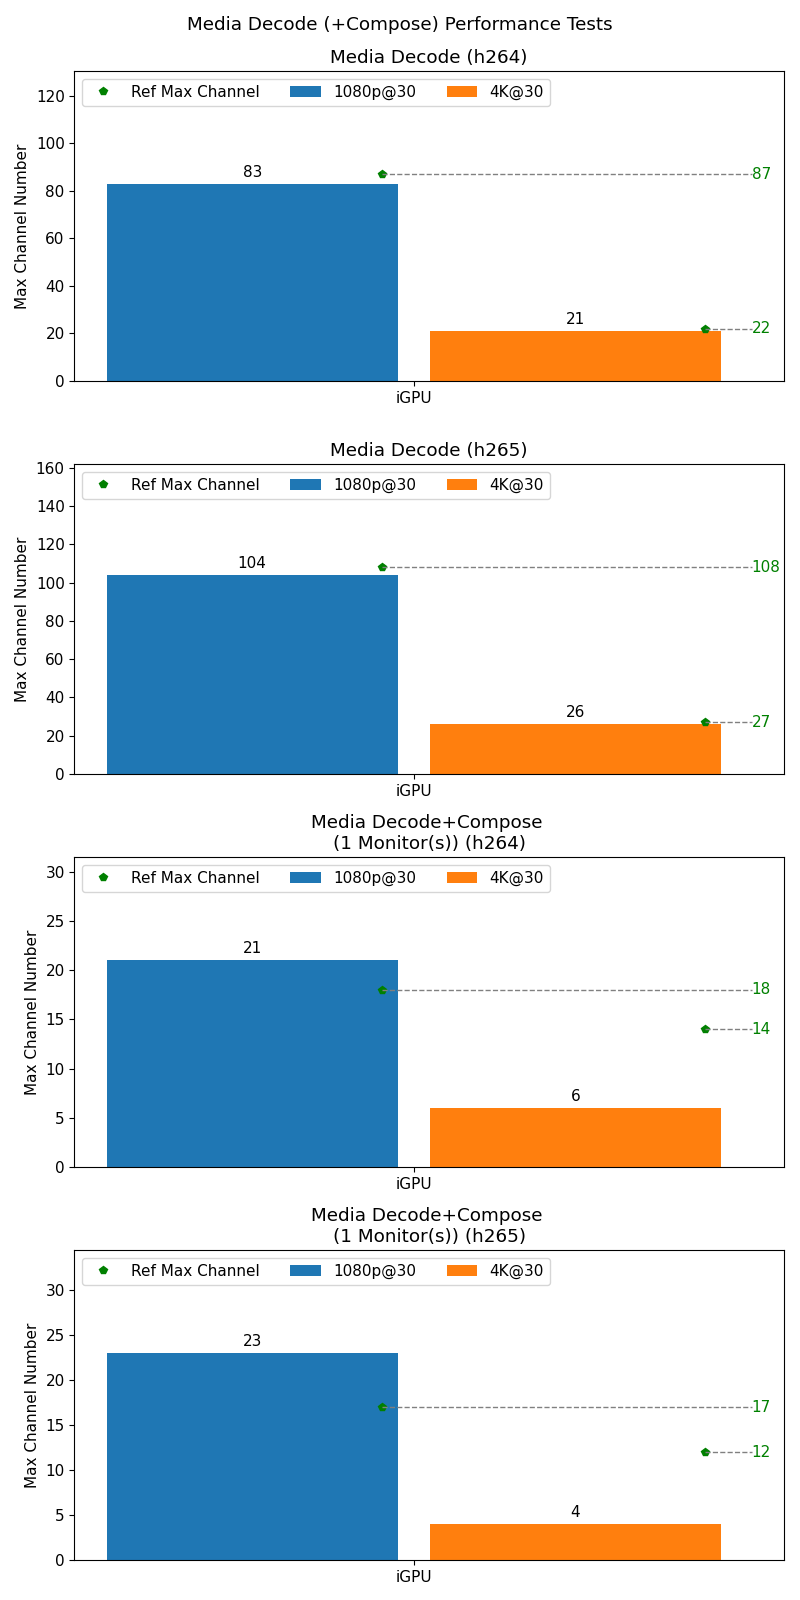
Media Encode and Decode Performance tests.
| Media Performance Benchmark | Device Used | Codec | Bitrate | Resolution | Number of Monitors | Max Channels | Reference Platform | Reference Value | AVG CPU Freq(MHz) | AVG CPU Util(%) | AVG Memory Util(%) | AVG GPU Freq(MHz) | AVG GPU EU(RCS) Util(%) | AVG GPU VDBox(VCS) Util(%) | Avg SoC Power (W) | AVG GPU power(W) | Duration(s) | Result |
|---|---|---|---|---|---|---|---|---|---|---|---|---|---|---|---|---|---|---|
| Media Encode Benchmark | iGPU | h264 | 4Mbps | 1080p@30 | N/A | 18 | i7-1360P (16G Mem) | 17 | 2690.61 | 46.21 | 0.60 | 1193.75 | 0.78 | 90.69 | 35.05 | 3.14 | 723.89 | No Error |
| Media Encode Benchmark | iGPU | h264 | 16Mbps | 4K@30 | N/A | 4 | i7-1360P (16G Mem) | 4 | 2136.78 | 8.23 | 0.20 | 1199.61 | 19.65 | 77.96 | 32.14 | 3.38 | 426.31 | No Error |
| Media Encode Benchmark | iGPU | h265 | 2Mbps | 1080p@30 | N/A | 26 | i7-1360P (16G Mem) | 27 | 2857.15 | 109.17 | 2.40 | 1180.93 | 0.80 | 0.00 | 34.70 | 4.24 | 526.21 | No Error |
| Media Encode Benchmark | iGPU | h265 | 8Mbps | 4K@30 | N/A | 5 | i7-1360P (16G Mem) | 6 | 2255.40 | 11.77 | 1.40 | 1199.85 | 24.62 | 0.00 | 35.33 | 4.34 | 341.30 | No Error |
Media Performance Test Result
Media Encode and Decode Performance tests.
Media Performance Test Result
Media Encode and Decode Performance tests.
| Media Performance Benchmark | Device Used | Input Codec | Input Bitrate | Input Resolution | Number of Monitors | Max Channels | Reference Platform | Reference Value | AVG CPU Freq(MHz) | AVG CPU Util(%) | AVG Memory Util(%) | AVG GPU Freq(MHz) | AVG GPU EU(RCS) Util(%) | AVG GPU VDBox(VCS) Util(%) | Avg SoC Power (W) | AVG GPU power(W) | Duration(s) | Result |
|---|---|---|---|---|---|---|---|---|---|---|---|---|---|---|---|---|---|---|
| Media Decode Benchmark | iGPU | h264 | 4Mbps | 1080p@30 | N/A | 83 | i7-1360P (16G Mem) | 87 | 3079.35 | 166.89 | 0.40 | 1182.21 | 0.80 | 0.00 | 35.12 | 2.20 | 769.62 | No Error |
| Media Decode Benchmark | iGPU | h264 | 16Mbps | 4K@30 | N/A | 21 | i7-1360P (16G Mem) | 22 | 2723.17 | 21.35 | 0.20 | 1194.90 | 0.78 | 0.00 | 35.31 | 2.21 | 527.66 | No Error |
| Media Decode Benchmark | iGPU | h265 | 2Mbps | 1080p@30 | N/A | 104 | i7-1360P (16G Mem) | 108 | 3112.45 | 187.10 | 0.50 | 1180.87 | 0.81 | 0.00 | 34.95 | 2.67 | 761.20 | No Error |
| Media Decode Benchmark | iGPU | h265 | 8Mbps | 4K@30 | N/A | 26 | i7-1360P (16G Mem) | 27 | 2883.20 | 31.89 | 0.20 | 1180.33 | 0.80 | 0.00 | 34.98 | 2.65 | 519.81 | No Error |
| Media Decode + 6*6 Compose Benchmark to 1080p@30FPS | iGPU | h264 | 4Mbps | 1080p@30 | 1 | 21 | i7-1360P (16G Mem) | 18 | 2923.51 | 251.52 | 0.80 | 1148.85 | 1.35 | 0.00 | 35.13 | 1.95 | 876.57 | No Error |
| Media Decode + 6*6 Compose Benchmark to 4K@30FPS | iGPU | h264 | 16Mbps | 4K@30 | 1 | 6 | i7-1360P (16G Mem) | 14 | 2436.42 | 229.73 | 0.40 | 1037.26 | 0.00 | 0.00 | 34.87 | 1.84 | 378.43 | No Error |
| Media Decode + 6*6 Compose Benchmark to 1080p@30FPS | iGPU | h265 | 2Mbps | 1080p@30 | 1 | 23 | i7-1360P (16G Mem) | 17 | 2968.77 | 254.00 | 0.90 | 856.79 | 0.00 | 0.00 | 34.98 | 1.76 | 1136.24 | No Error |
| Media Decode + 6*6 Compose Benchmark to 4K@30FPS | iGPU | h265 | 8Mbps | 4K@30 | 1 | 4 | i7-1360P (16G Mem) | 12 | 2409.34 | 191.10 | 0.25 | 659.50 | 0.00 | 0.00 | 35.10 | 1.12 | 470.44 | No Error |
Media Performance Test Result
Media Encode and Decode Performance tests.
Details of Media Performance Test
media_performance_benchmark.tar.gz
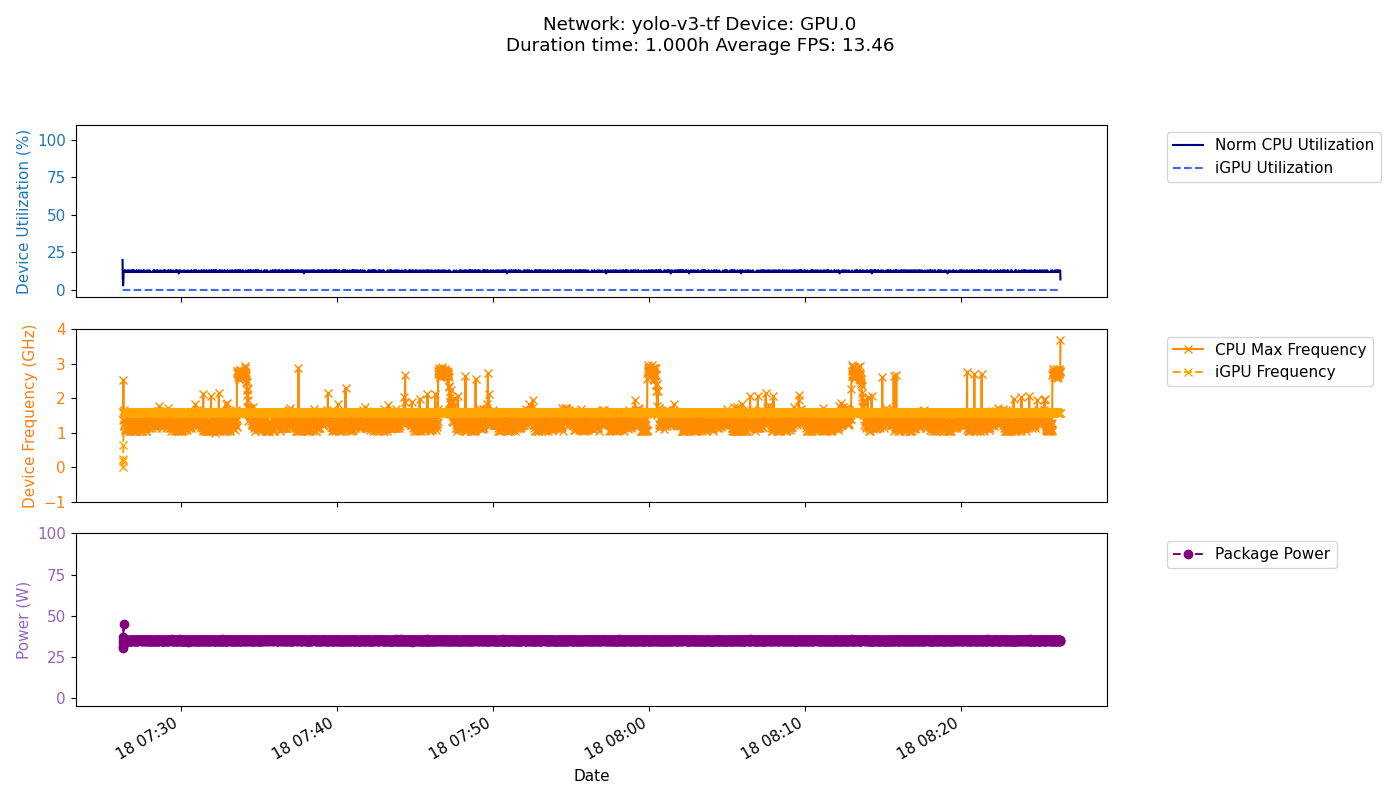
GPU Freq Performance Test Result
This test uses the OpenVINO benchmark app to exercise the GPU for an extended period and while tracking its frequency.
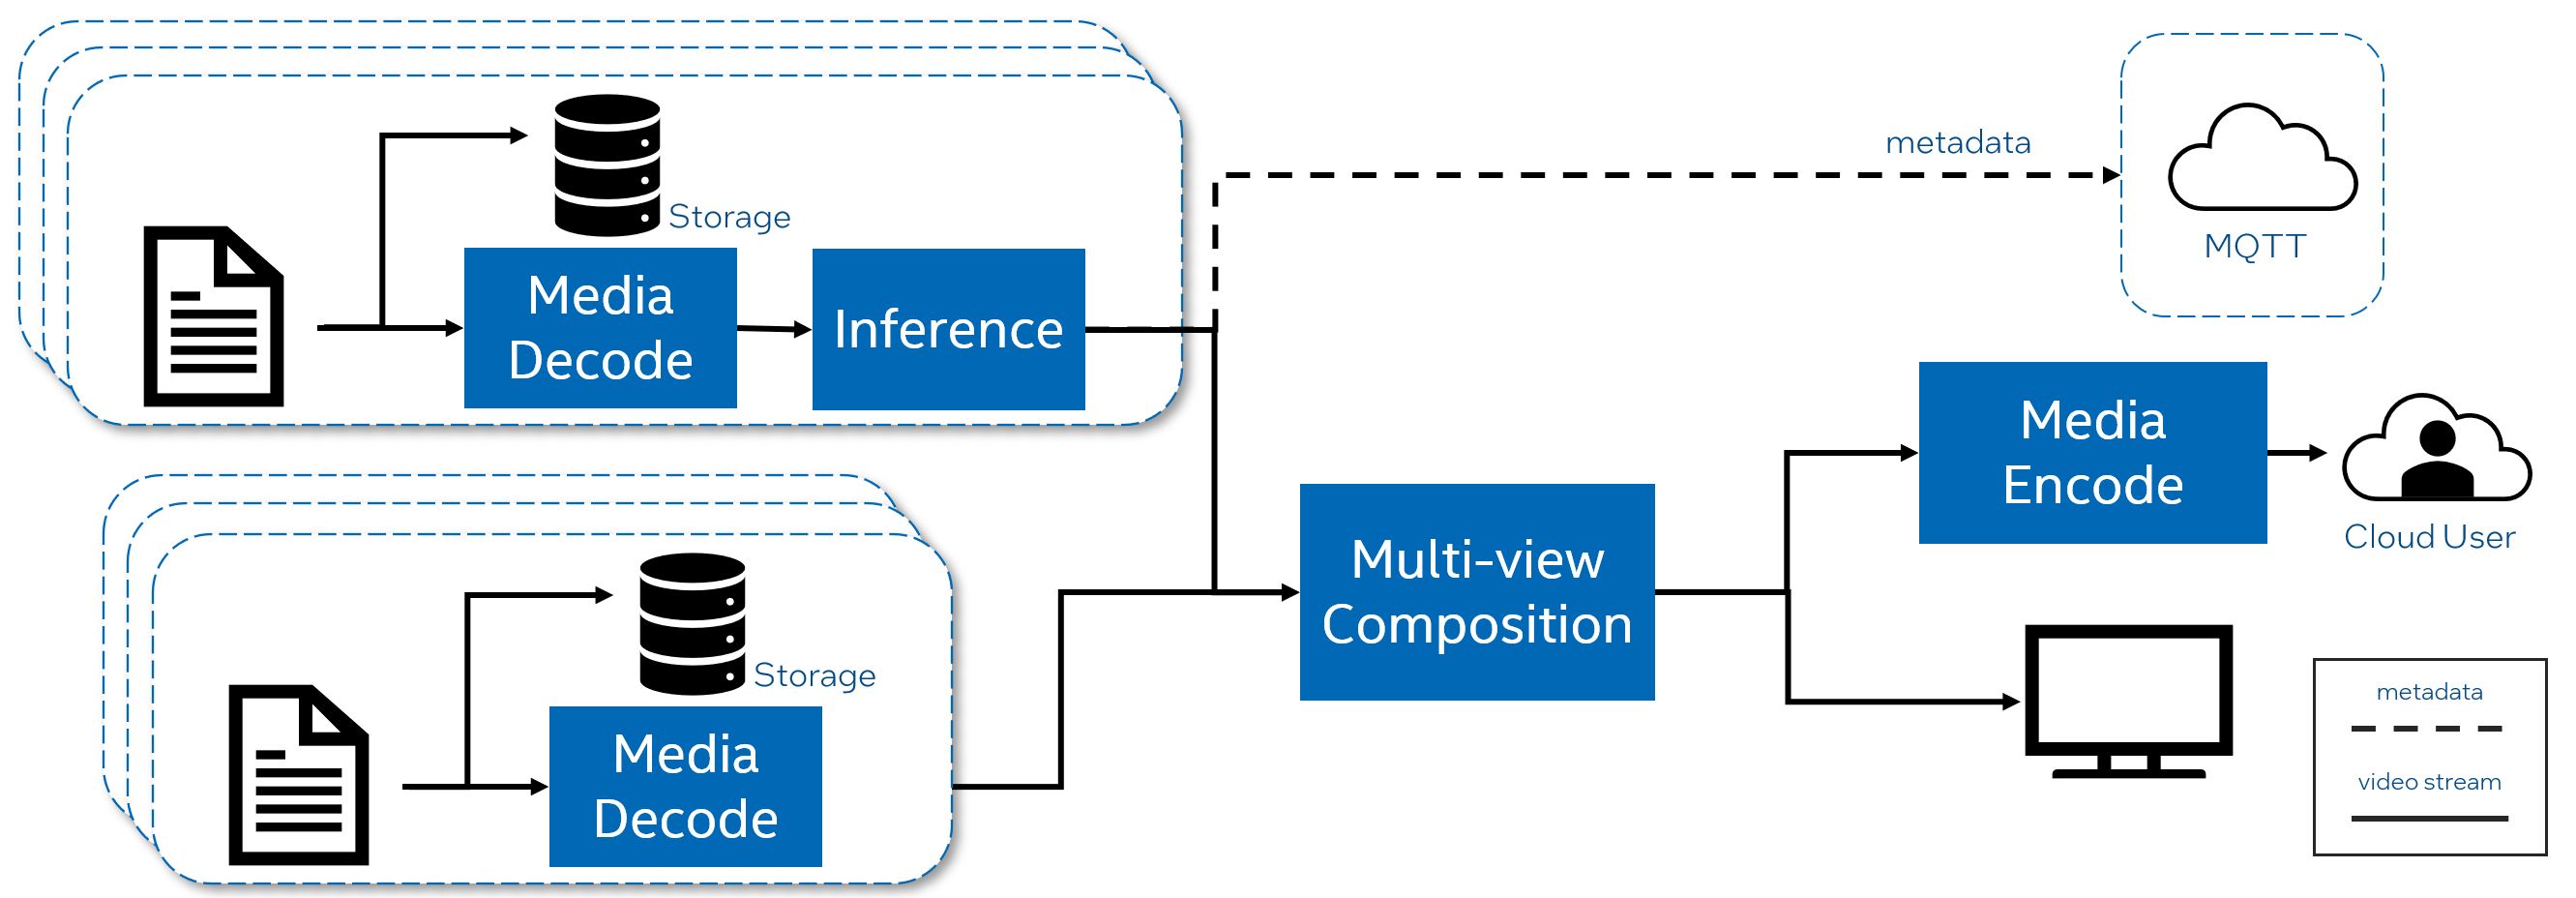
Smart NVR Proxy Pipeline Benchmark Test Introduction
Benchmark Specification: Input: 1080p@30 H.264 4Mbps (video with 10 objects); Storage: 1080p@30 H.264 4Mbps; Output: VideoWall, 4K@30 H264 16Mbps; Benchmark metric: Number of video channels with inference.
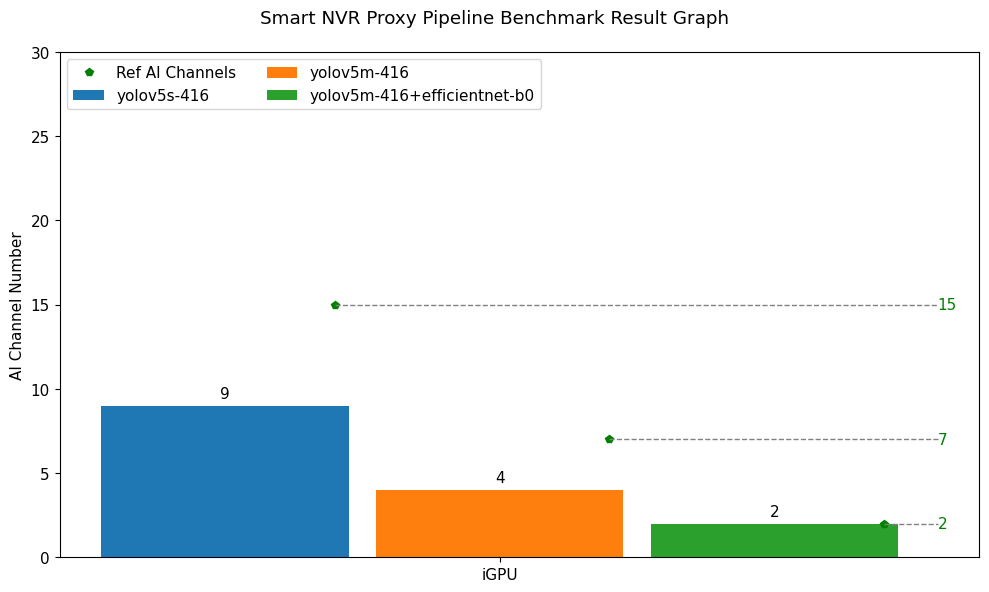
Smart NVR Proxy Pipeline Benchmark Test Result
Benchmark Specification: Input: 1080p@30 H.264 4Mbps (video with 10 objects); Storage: 1080p@30 H.264 4Mbps; Output: VideoWall, 4K@30 H264 16Mbps; Benchmark metric: Number of video channels with inference.
| Pipeline_Test | Device Used | Input Codec | Input Resolution | Input Channels | Model | Compose | Number of Monitors | AI Channels | Reference Platform | Reference Value | AVG CPU Freq(MHz) | AVG CPU Util(%) | AVG Memory Util(%) | AVG GPU Freq(MHz) | AVG GPU EU(RCS) Util(%) | AVG GPU VDBox(VCS) Util(%) | AVG package power(W) | AVG GPU power(W) | Duration(s) | Result |
|---|---|---|---|---|---|---|---|---|---|---|---|---|---|---|---|---|---|---|---|---|
| Smart NVR Pipeline | iGPU | H264 (4Mbps) | 1080p@20 | 25 | yolov5s-416 | 5x5 | 1 | 9 | i7-1360p (16G Mem) | 15 | 1878.06 | 1362.12 | 1.54 | 983.55 | 0.00 | 0.00 | 34.82 | 5.49 | 861.82 | No Error |
| Smart NVR Pipeline | iGPU | H264 (4Mbps) | 1080p@20 | 25 | yolov5m-416 | 5x5 | 1 | 4 | i7-1360p (16G Mem) | 7 | 1871.53 | 877.24 | 2.08 | 1175.10 | 0.00 | 0.00 | 35.19 | 7.33 | 641.83 | No Error |
| Smart NVR Pipeline | iGPU | H264 (4Mbps) | 1080p@20 | 25 | yolov5m-416+efficientnet-b0 | 5x5 | 1 | 2 | i7-1360p (16G Mem) | 2 | 2121.69 | 568.02 | 1.47 | 1286.80 | 0.00 | 0.00 | 35.12 | 7.09 | 579.03 | No Error |
Smart NVR Proxy Pipeline Benchmark Test Result
Benchmark Specification: Input: 1080p@30 H.264 4Mbps (video with 10 objects); Storage: 1080p@30 H.264 4Mbps; Output: VideoWall, 4K@30 H264 16Mbps; Benchmark metric: Number of video channels with inference.
Headed Visual AI Proxy Pipeline Benchmark Test Introduction
Benchmark Specification: Input: 1080p@30 H.264 4Mbps (video with 10 objects); Output: VideoWall, 4K@30 H264 16Mbps; Benchmark metric: Number of video channels.
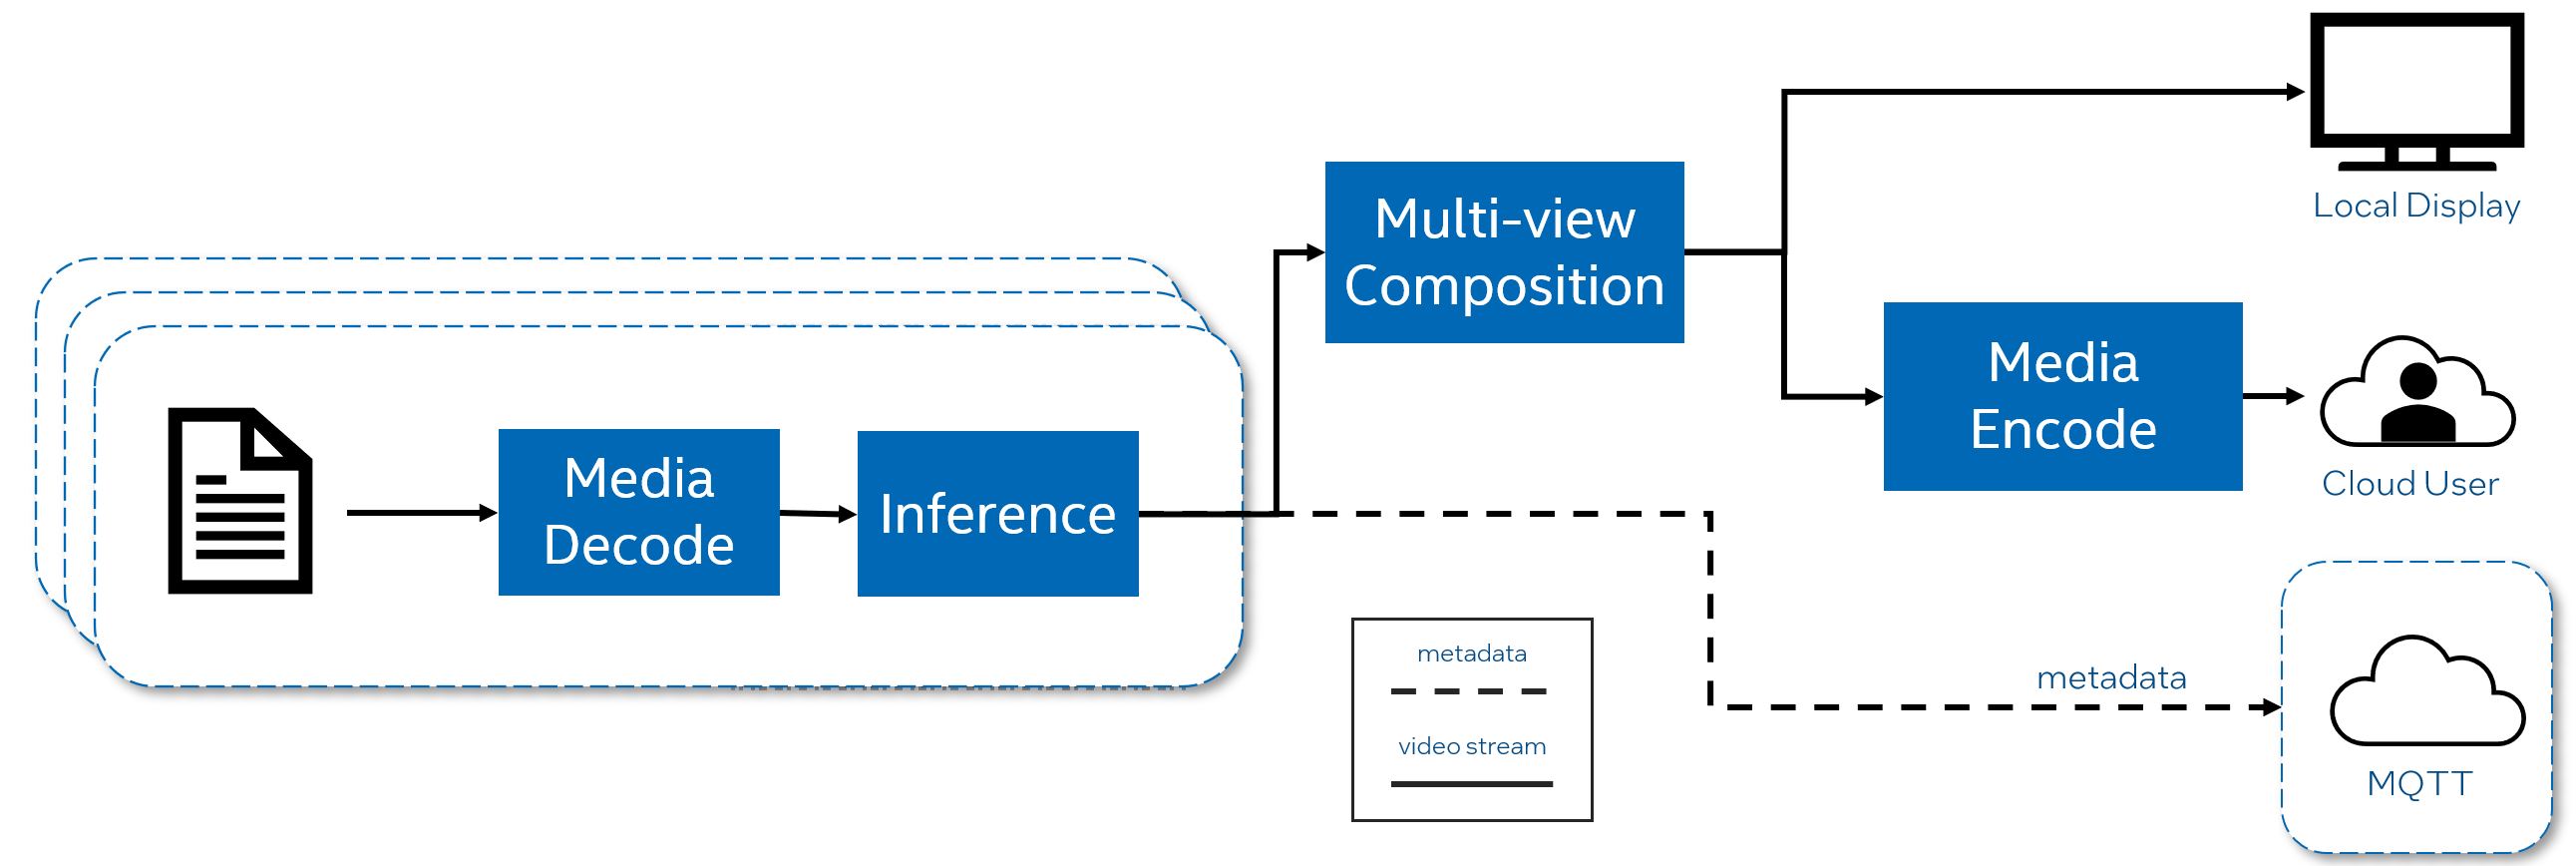
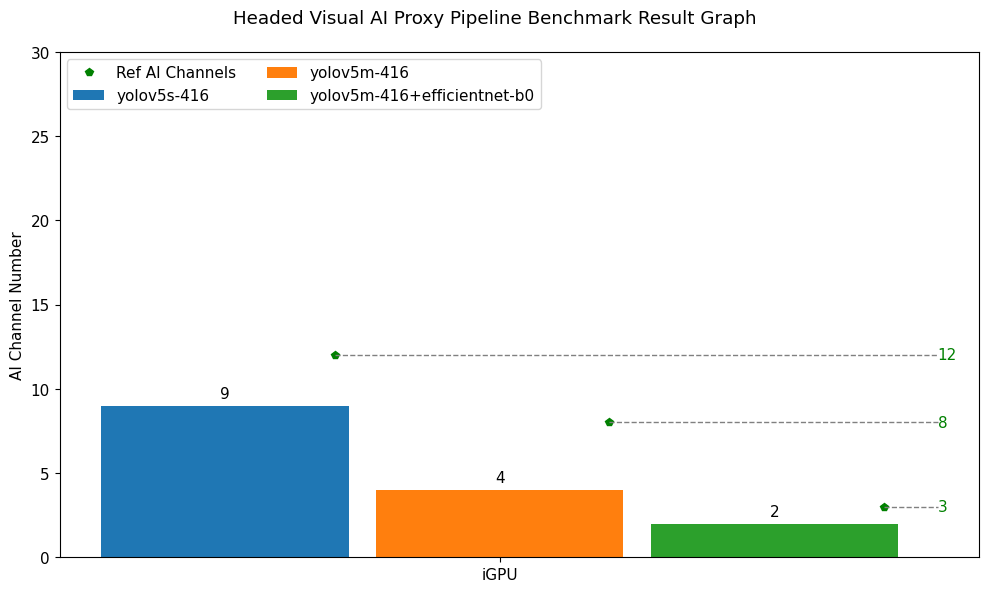
Headed Visual AI Proxy Pipeline Benchmark Test Result
Benchmark Specification: Input: 1080p@30 H.264 4Mbps (video with 10 objects); Output: VideoWall, 4K@30 H264 16Mbps; Benchmark metric: Number of video channels.
| Pipeline_Test | Device Used | Input Codec | Input Resolution | Input Channels | Model | Compose | Number of Monitors | AI Channels | Reference Platform | Reference Value | AVG CPU Freq(MHz) | AVG CPU Util(%) | AVG Memory Util(%) | AVG GPU Freq(MHz) | AVG GPU EU(RCS) Util(%) | AVG GPU VDBox(VCS) Util(%) | AVG package power(W) | AVG GPU power(W) | Duration(s) | Result |
|---|---|---|---|---|---|---|---|---|---|---|---|---|---|---|---|---|---|---|---|---|
| Headed Visual AI Pipeline | iGPU | H264 (4Mbps) | 1080p@30 | 9 | yolov5s-416 | 4x4 | 1 | 9 | i7-1360p (16G Mem) | 12 | 1913.64 | 1451.96 | 1.26 | 1017.27 | 0.00 | 0.00 | 34.92 | 5.50 | 790.53 | No Error |
| Headed Visual AI Pipeline | iGPU | H264 (4Mbps) | 1080p@30 | 4 | yolov5m-416 | 4x4 | 1 | 4 | i7-1360p (16G Mem) | 8 | 1762.91 | 839.01 | 1.59 | 1256.13 | 0.00 | 0.00 | 35.12 | 7.51 | 582.66 | No Error |
| Headed Visual AI Pipeline | iGPU | H264 (4Mbps) | 1080p@30 | 2 | yolov5m-416+efficientnet-b0 | 4x4 | 1 | 2 | i7-1360p (16G Mem) | 3 | 1899.26 | 497.00 | 1.57 | 1382.08 | 0.00 | 0.00 | 34.94 | 7.71 | 402.88 | No Error |
Headed Visual AI Proxy Pipeline Benchmark Test Result
Benchmark Specification: Input: 1080p@30 H.264 4Mbps (video with 10 objects); Output: VideoWall, 4K@30 H264 16Mbps; Benchmark metric: Number of video channels.
Details of Headed Visual AI Proxy Pipeline Benchmark Test
headed_visual_ai_proxy_pipeline_runner.tar.gz
VSaaS Gateway with Storage Proxy Pipeline Benchmark Test Introduction
Benchmark Specification: Input: 1080p@30 H.264 4Mbps (video with 10 objects); Storage: 1080p@30 H.265 2Mbps; Output: 1080p@30 H.265 2Mbps; Benchmark metric: Number of video channels.
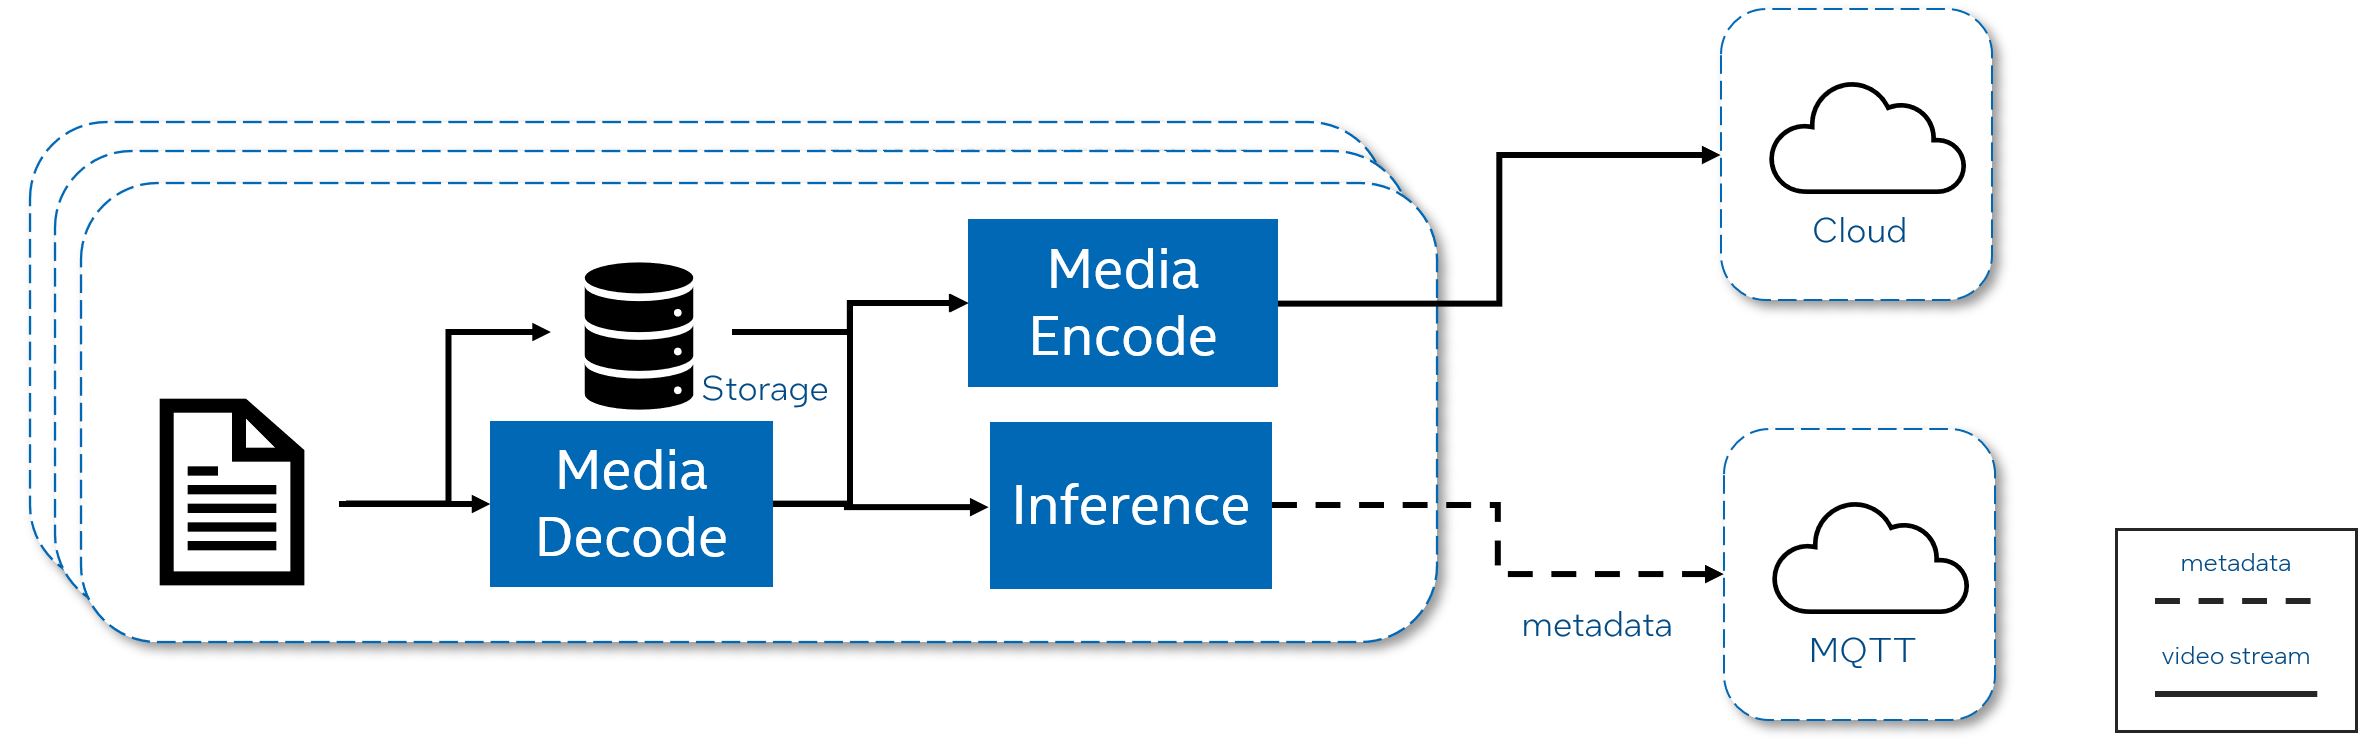
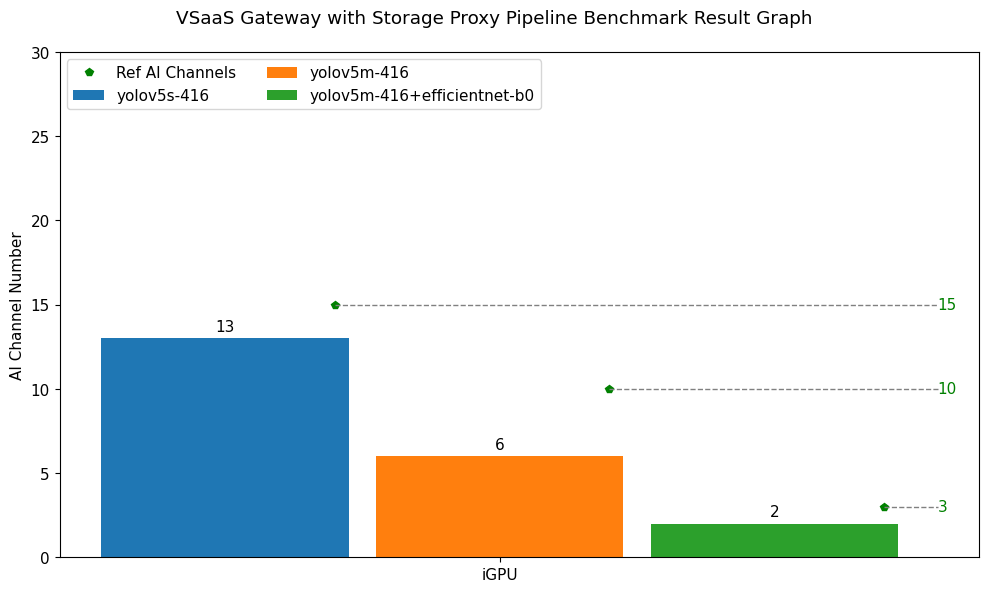
VSaaS Gateway with Storage Proxy Pipeline Benchmark Test Result
Benchmark Specification: Input: 1080p@30 H.264 4Mbps (video with 10 objects); Storage: 1080p@30 H.265 2Mbps; Output: 1080p@30 H.265 2Mbps; Benchmark metric: Number of video channels.
| Pipeline_Test | Device Used | Input Codec | Input Resolution | Input Channels | Model | Compose | Number of Monitors | AI Channels | Reference Platform | Reference Value | AVG CPU Freq(MHz) | AVG CPU Util(%) | AVG Memory Util(%) | AVG GPU Freq(MHz) | AVG GPU EU(RCS) Util(%) | AVG GPU VDBox(VCS) Util(%) | AVG package power(W) | AVG GPU power(W) | Duration(s) | Result |
|---|---|---|---|---|---|---|---|---|---|---|---|---|---|---|---|---|---|---|---|---|
| AI VSaaS Gateway Pipeline | iGPU | H264 (4Mbps) | 1080p@30 | 13 | yolov5s-416 | N/A | N/A | 13 | i7-1360p (16G Mem) | 15 | 2265.00 | 223.11 | 1.30 | 1341.73 | 0.00 | 0.00 | 35.04 | 10.09 | 659.57 | No Error |
| AI VSaaS Gateway Pipeline | iGPU | H264 (4Mbps) | 1080p@30 | 6 | yolov5m-416 | N/A | N/A | 6 | i7-1360p (16G Mem) | 10 | 2028.52 | 210.49 | 0.80 | 1489.00 | 0.00 | 0.00 | 35.11 | 11.36 | 779.16 | No Error |
| AI VSaaS Gateway Pipeline | iGPU | H264 (4Mbps) | 1080p@30 | 2 | yolov5m-416+efficientnet-b0 | N/A | N/A | 2 | i7-1360p (16G Mem) | 3 | 2234.06 | 283.56 | 1.38 | 1477.59 | 0.00 | 0.00 | 35.03 | 9.16 | 336.40 | No Error |
VSaaS Gateway with Storage Proxy Pipeline Benchmark Test Result
Benchmark Specification: Input: 1080p@30 H.264 4Mbps (video with 10 objects); Storage: 1080p@30 H.265 2Mbps; Output: 1080p@30 H.265 2Mbps; Benchmark metric: Number of video channels.
Details of VSaaS Gateway with Storage Proxy Pipeline Benchmark Test
ai_vsaas_proxy_pipeline_runner.tar.gz
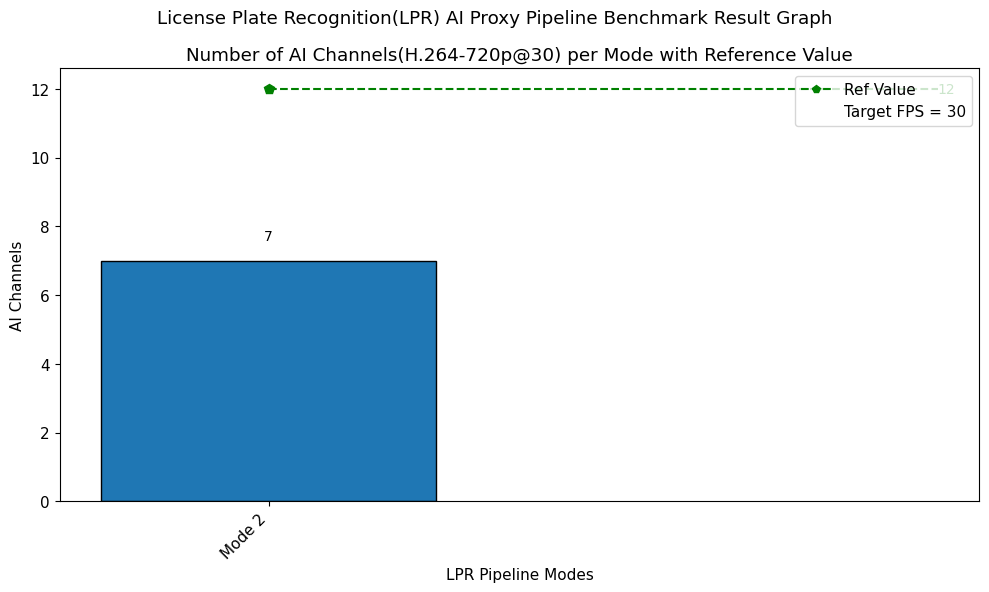
License Plate Recognition(LPR) AI Proxy Pipeline Benchmark Introduction
License Plate Recognition(LPR) Pipeline Benchmark
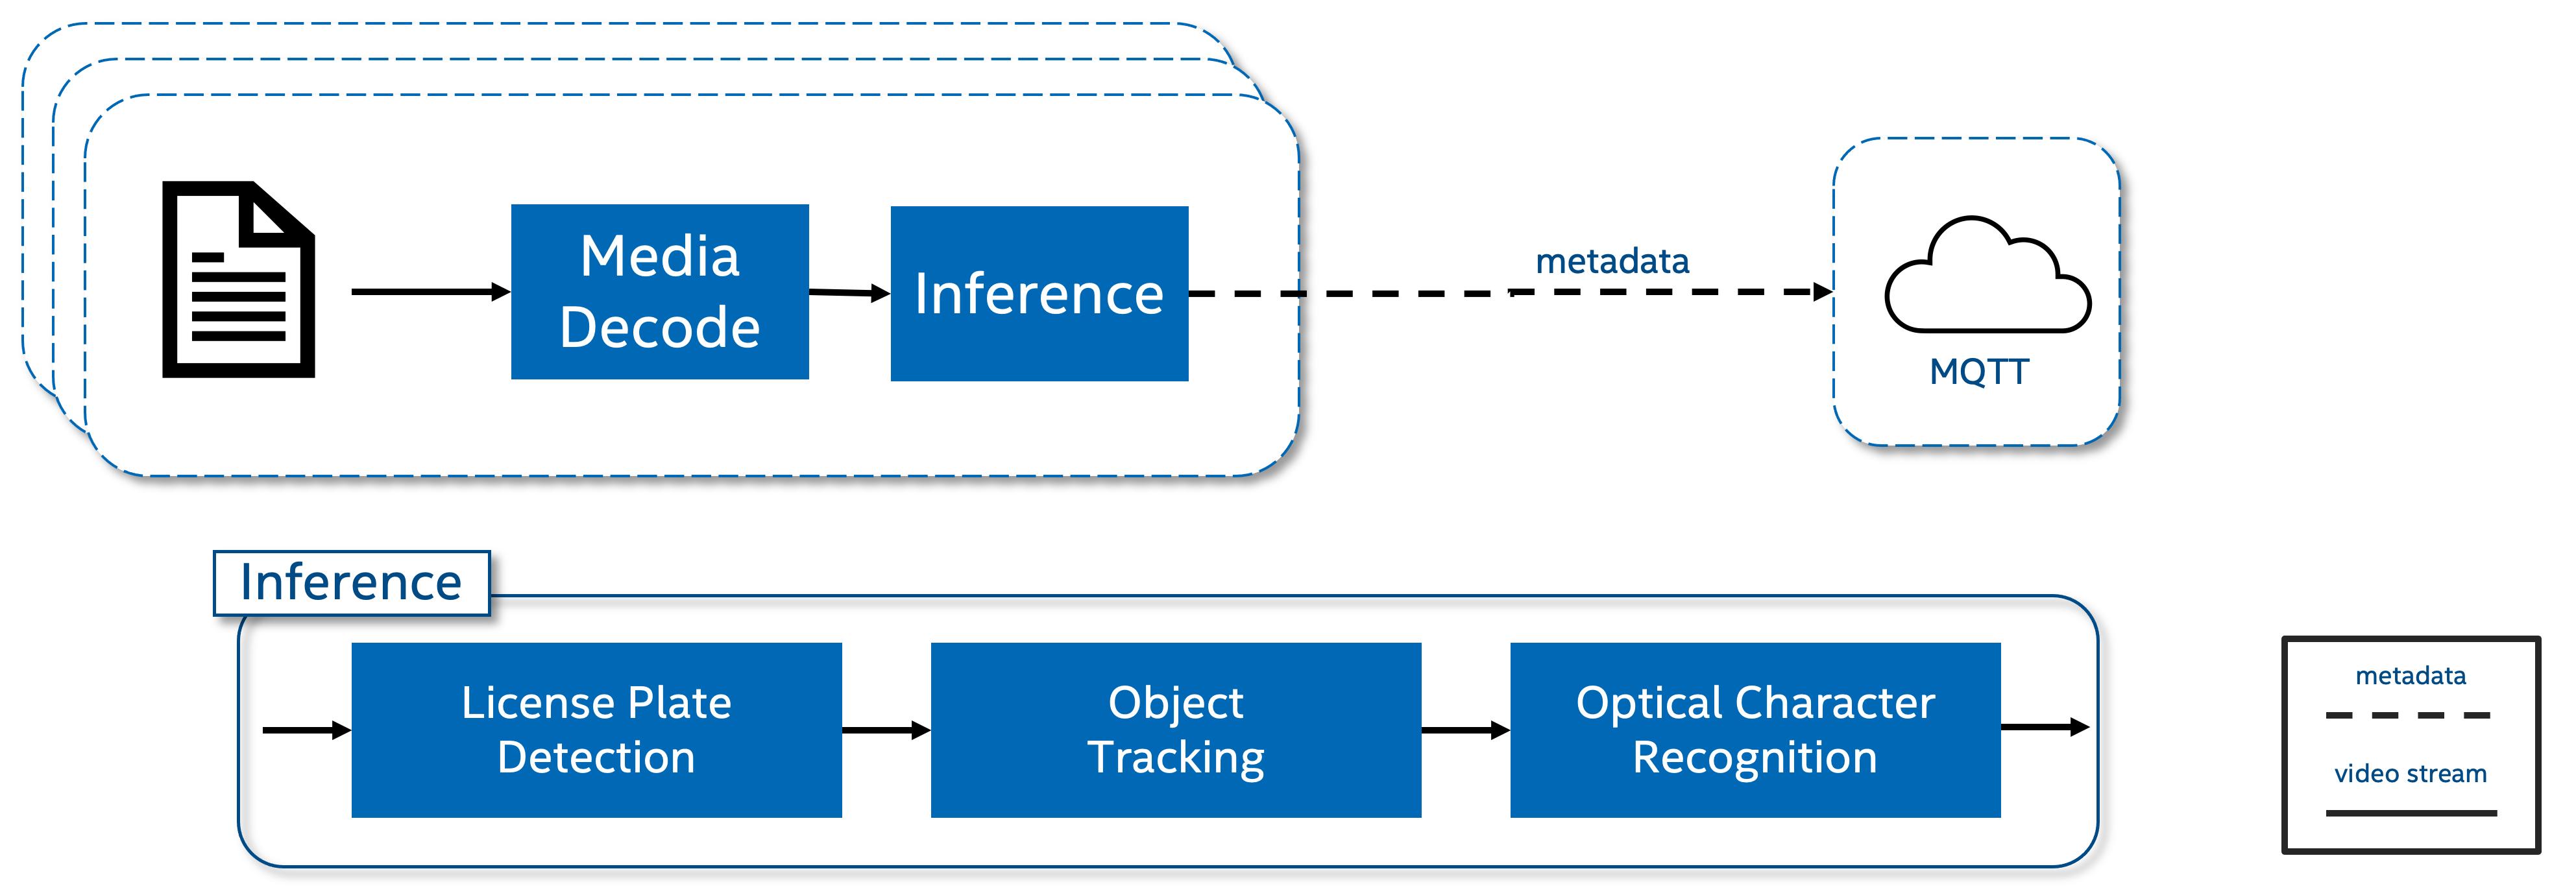
License Plate Recognition(LPR) AI Proxy Pipeline Benchmark Result
License Plate Recognition(LPR) Pipeline Benchmark
| Pipeline Test | Model | Mode | Devices Used | AI Channels | Avg FPS | Reference Platform | Reference Value | AVG CPU Freq(MHz) | AVG CPU Util(%) | AVG Memory Util(%) | AVG GPU Freq(MHz) | AVG GPU EU(RCS) Util(%) | AVG GPU VDBox(VCS) Util(%) | AVG package power(W) | AVG GPU power(W) | Duration(s) | Result |
|---|---|---|---|---|---|---|---|---|---|---|---|---|---|---|---|---|---|
| LPR Pipeline | yolov8_license_plate_detector+ch_PP-OCRv4_rec_infer | Mode 2 | iGPU(Dec)/iGPU(Det)/iGPU(Cls) | 7 | 32.56 | i7-1360p (16G Mem) | 12 | 1625.64 | 303.52 | 0.60 | 1463.59 | 0.00 | 0.00 | 34.87 | 12.01 | 315.65 | No Error |
License Plate Recognition(LPR) AI Proxy Pipeline Benchmark Result
License Plate Recognition(LPR) Pipeline Benchmark